

Author: Lori Alden
Audience: High school and college economics students
Summary: With this series of 12 puzzles, you can help your students become more discriminating consumers of economic statistics.
Procedure: Each of the following problems shows one or more misleading statistics. See if your students can figure out why they're misleading.
1. The following statistics suggest that 16-year-olds are safer drivers than people in their twenties, and that octogenarians are very safe. Is this true?
Solution: No. As the following graph shows, the reason 16-year-old and octogenarians appear to be safe drivers is that they don't drive nearly as much as people in other age groups.
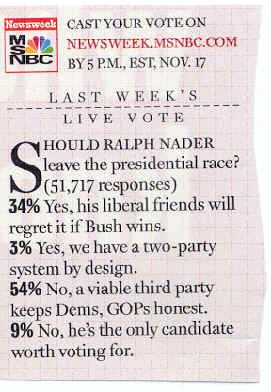
2. On November 13, 2000, Newsweek published the following poll results:
Since 9% said that Nader was the only candidate worth voting for, one would have expected him to get at least 9% of the vote in the 2000 election. He only got about 3%. What happened?
Solution:
There was a biased statistic because the sample wasn't randomly drawn from the population. A disproportionate number of Nader supporters participated in the poll in order to make him appear more viable as a candidate.
3. Consider these complaints about airlines published in US News and World Report on February 5, 2001:
Can we conclude that United, American, and Delta are the worst airlines and Alaska, Southwest, and Continental are the best?
Solution: No. The airlines that had the most complaints also had the most passengers. As the following graph shows, rates and percentages are often more informative than raw numbers.
4. The following statistics about motorcycle helmet use seem to suggest that helmets cause more injuries and fatalities. Is it really safer to go without helmets?
Source: Motorcycle Statistical Annual, Motorcycle Industry Council, Inc., 1994, as reported on http://www.bikersrights.com/statistics/stats.html.
Solution: Correlation doesn't prove causation. The statistics suggest that helmets cause accidents and fatalities, but it's possible that a high number of motorcycle accidents and fatalities in high-risk states caused them to adopt mandatory helmet laws.
5. This clipping from US News and World Report on 1/29/01 suggests that Alaskans are terrible parents. Is this true?
Solution: The difference in the abuse rates probably stems from different definitions for abuse in the various states. For example, Alaska (the "worst" state) says that a child is abused if his or her health or welfare is harmed or threatened. Pennsylvania (the "best" state) defines it as a recent act or failure to act.
6. Columnist George Will wrote in the Washington Post in 1993 that "... the 10 states with the lowest per pupil spending included four — North Dakota, South Dakota, Tennessee, Utah — among the 10 states with the top SAT scores ... New Jersey has the highest per pupil expenditures, an astonishing $10,561… [Its] rank regarding SAT scores? Thirty-ninth."
This negative correlation between spending per pupil and SAT performance seems to be borne out by this graph:
And by this one:
Does this mean that spending more on education makes students worse off?
Solution: The results are more likely due to differing SAT participation rates in the states (Colleges in North Dakota and other states require the ACT rather than the SAT for college admissions). The students who take the SAT in North Dakota include many who plan to apply to elite out-of-state colleges.
This caused a sampling bias, since the sample wasn't representative of the population.
7. Researchers (Arthur Kellermann et. al., "Gun Ownership as a Risk Factor for Homicide in the Home," The New England Journal of Medicine, October 7, 1993, pp. 1084-1091), found that gun owners are 2.7 times more likely to be murdered than non-owners. Does this mean it's safer to not have guns in the house?
Solution: Perhaps, but correlation does not imply causation. It may be true that guns cause murders, but it might also be true that having a greater risk of being murdered causes people to own guns.
8. "The best public schools offer a more challenging curriculum than most private schools." Are public schools therefore better than private schools?
Solution: We're being asked to compare apples with oranges: the best public schools versus most private schools.
9. "Fluoride consumption by human beings increases the general cancer death rate. …. [P]eople in fluoridated areas have a higher cancer death rate than those in non-fluoridated areas." Should fluoridation be prohibited?
Solution: Affluent areas are more likely to have fluoridation and they're also more likely to have older populations who are more likely to get cancer.
10. Can we conclude from the following diagram that it's safer to drive while under the influence?
Solution: No. Drunk drivers have a fatality risk 7.66 times the norm, while non-drunk drivers have a risk only about .6 of the norm. Only a very small percentage of drivers in New York City drive while under the influence, but they account for a disproportionate number of accidents.
11. The Monthly Labor Review published the following data, showing how earnings vary with education:
Can we conclude that getting a bachelor's degree will increase your earnings by almost $13,000 a year?
Solution: Not necessarily. Intelligence and drive also explain the differences in earnings, people with intelligence and drive are more likely to go to college.
12. Allen Hershkowitz, senior scientist with the Natural Resources Defense Council, wrote that "a well-run curbside recycling program can cost anywhere from $50 to more than $150 per ton of materials collected. Typical trash collection and disposal programs, on the other hand, cost anywhere from $70 to more than $200 per ton." Does recycling save money?
Solution: Hershkowitz asks us to compare apples with oranges: a well-run curbside recycling program with typical trash collection and disposal programs.
© Lori Alden, 2005-7. All rights reserved. You may download the content, provided you only use the content for your own personal, non-commercial use. Lori Alden reserves complete title and full intellectual property rights in any content you download from this web site. Except as noted above, any other use, including the reproduction, modification, distribution, transmission, republication, display, or performance, of the content on this site is strictly prohibited.